HiFinance
4
SECTION
3.4.4.1 - SALES ACTIVITY - BY PERIOD
USAGE: To report on period sales. The report prints the
sales and cost-of-sales for a period and compares them with the year-to-date
sales.
DISCUSSION: When you choose this report, HiFinance will
firstly ask you in which order you wish to print the items. The screen will
appear as follows:
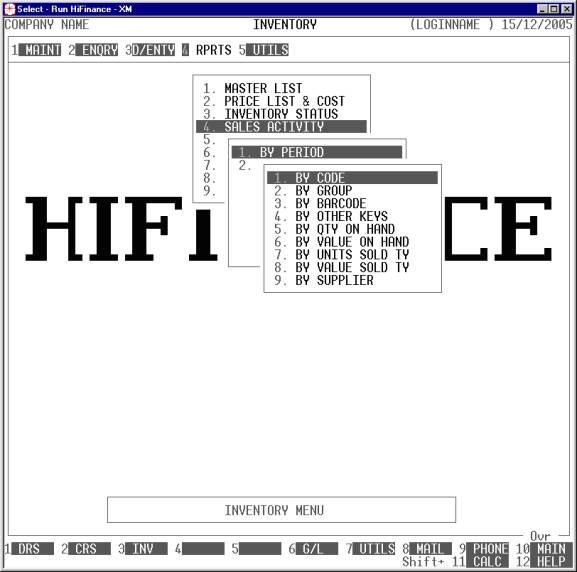
Choose the order you wish to print the report in by
pressing the number next to the option. If you choose to print BY OTHER KEYS, another menu will open to allow you to specify
which of the three OTHER KEYS you actually require.
The report is similar irrespective of report order,
however certain sort orders allow sub-totals to be printed (eg by GROUP). Also if you intend to limit the
report to a range of Inventory items, it is more efficient to print the
report in that order, because HiFinance can then optimise the search
pattern.
When you enter this program, the following questions
will appear:
USE LONG FORMAT REPORT If you are using wide stationery, reply Y, otherwise reply N. This question will only be
displayed if the relevant option is set to A, see SECTION 7.1.2.
PRINT SUB-TOTALS ONLY Certain sort options, eg GROUP can be made to print
as sub-totals only. If you choose to print the report this way, only the totals
will be printed, eg a total for each group. You should take care not to print
in an order where the key might be blank. For instance, if you choose to print
in OTHER-KEY1 order and some of the stock codes have blank OTHER-KEY1’s, they
will not appear on the report. (If you choose this option, the next question
will be suppressed.)
START A NEW PAGE ON
CHANGE OF KEY Certain sort options will
sub-total at the end of each group, eg GROUP.
If you wish HiFinance to insert a page break at the end of each group, reply Y. Otherwise the report will flow on continuously after printing the
sub-total.
UP TO YEAR [ ] (L)ast,
(T)his or (N)next year. PERIOD [..] This report is generated up to
a period. By default, this is the current period but you can change the period
if you wish. Enter a year, eg L for last year, T for this year or N for next year. Then enter
the period number, 1 - 12, within that year. Note that next year can only have periods 1 - 3.
LIMIT REPORT TO LOCATION This question is only relevant to companies using
multi-location stock. In this case, you may either choose to print the report
for one location or the combined total for all locations.
The following question asks you to enter both a
lower and upper limit. The upper limit must not be less than the lower limit.
The default answers define the extreme limits of the field. You do not have to
change all of these limits. Only change the ones you wish to, and tab past the
others.
CODE RANGE This is the Inventory’s code.
GROUP RANGE This is the Inventory Group.
BARCODE This is the primary barcode field.
OTHER KEY RANGE This may appear as a different literal depending on how
you have defined the field in SYSTEM
PARAMETERS.
QTY ON-HAND RANGE This is the total units on hand.
VALUE ON-HAND RANGE This is the total value on hand.
YTD QTY SOLD RANGE This is the total units invoiced in the current year.
YTD VALUE SOLD RANGE This is the total value invoiced in the current year.
LAST SALE RANGE This allows you to limit the report to a range of last
sale dates. Eg you might wish to only report on stock that has been sold
recently or has not been sold for a long time.
LAST PURCHASE RANGE This allows you to limit the report to a range of last purchase
dates. Eg you might wish to only report on stock that has been bought recently
or has not been bought for a long time.
SUPPLIER RANGE This allows you to limit the report to a range of Suppliers. Eg you might
wish to only report on stock that has been bought through a specific Creditor
or a range of Creditors.
INCLUDE OBSOLETE ITEMS If you enter N here, items that are
flagged as obsolete will be excluded from the report.
INCLUDE NON-OBSOLETE
ITEMS If you enter N here, items that are not flagged as obsolete will be excluded from the
report.
INCLUDE STOCKED ITEMS If you enter N here, items that are
flagged as normally stocked will be excluded from the report.
INCLUDE NON-STOCKED ITEMS If you enter N here, items that are
flagged as normally non-stocked will be excluded from the report.
INCLUDE ASSEMBLY ITEMS This question will only appear if you are using
Bill-of-Materials. If you enter N here, items that are
defined as assemblies will be excluded from the report.
INCLUDE NON-ASSEMBLY
ITEMS This question will only appear if you are
using Bill-of-Materials. If you enter N here, items that are not
defined as assemblies will be excluded from the report.
INCLUDE COMPONENT ITEMS This question will only appear if you are using Bill-of-Materials.
If you enter N here, items that are used
as components will be excluded from the report.
INCLUDE NON-COMPONENT
ITEMS This question will only appear if you are
using Bill-of-Materials. If you enter N here, items that are not
used as components will be excluded from the report.
To start the report, press <Enter> through each field or simply press <F10>.
The report itself will detail the Inventory code,
Description, Inventory Group, Barcode, units sold, the value of those sales and
the cost-of-sales, the gross profit (defined as (sales-cos)/sales x 100%. Then
the same is repeated for the year-to-date sales. The Short Format prints the
same information, but prints the year-to-date information under the
period-to-date information. At the end of the report, all columns are totalled.