HiFinance
4
SECTION
3.4.6.3 - RE-ORDER COMPARISON
USAGE: To print a list of all or a range of Inventory
items with their current stock levels, order information and sales information
together with over-stock and max-stock points. This reports gives a complete
breakdown of the stock situation without offering any suggestions for reorder.
DISCUSSION: When you choose this report, HiFinance will
firstly ask you in which order you wish to print the items. The screen will
appear as follows:
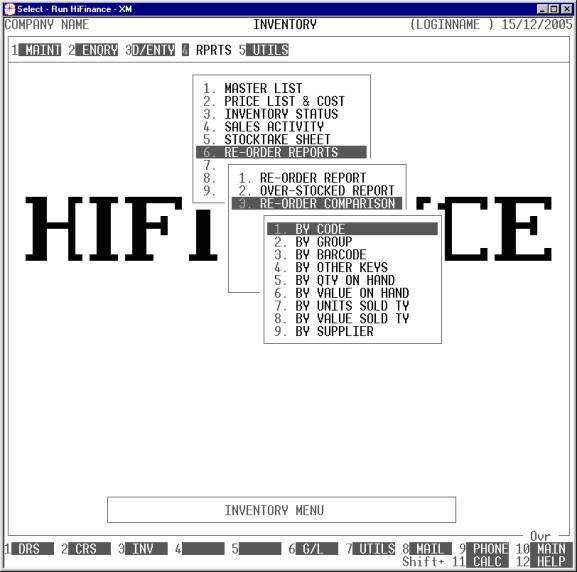
Choose the order you wish to print the report in by
pressing the number next to the option. If you choose to print BY OTHER KEYS, another menu will open to allow you to specify
which of the three OTHER KEYS you actually require.
The report is similar irrespective of report order,
however certain sort orders allow sub-totals to be printed (eg by GROUP). Also if you intend to limit the
report to a range of Inventory items, it is more efficient to print the
report in that order, because HiFinance can then optimise the search
pattern.
When you enter this program, the following questions
will appear:
USE LONG FORMAT REPORT If you are using wide stationery, reply Y, otherwise reply N. This question will only be
displayed if the relevant option is set to A, see SECTION 7.1.2.
START A NEW PAGE ON
CHANGE OF KEY Certain sort options will
sub-total at the end of each group, eg GROUP.
If you wish HiFinance to insert a page break at the end of each group, reply Y. Otherwise the report will flow on continuously after printing the
sub-total.
LIMIT REPORT TO LOCATION This question is only relevant to companies using
multi-location stock. In this case, you may either choose to print the
stock-on-hand for one location or the combined total for all locations.
The following question asks you to enter both a
lower and upper limit. The upper limit must not be less than the lower limit.
The default answers define the extreme limits of the field. You do not have to
change all of these limits. Only change the ones you wish to, and tab past the
others.
CODE RANGE This is the Inventory’s code.
GROUP RANGE This is the Inventory Group.
BARCODE This is the primary barcode field.
OTHER KEY RANGE This may appear as a different literal depending on how
you have defined the field in SYSTEM
PARAMETERS.
QTY ON-HAND RANGE This is the total units on hand (for all locations).
VALUE ON-HAND RANGE This is the total value on hand (for all locations).
YTD QTY SOLD RANGE This is the total units invoiced in the current year (for all
locations).
YTD VALUE SOLD RANGE This is the total value invoiced in the current year (for
all locations).
LAST SALE RANGE This allows you to limit the report to a range of last
sale dates. Eg you might wish to only report on stock that has been sold
recently or has not been sold for a long time.
LAST PURCHASE RANGE This allows you to limit the report to a range of last purchase
dates. Eg you might wish to only report on stock that has been bought recently
or has not been bought for a long time.
SUPPLIER RANGE This allows you to limit the report to a range of Suppliers. Eg you
might wish to only report on stock that has been bought through a specific
Creditor or a range of Creditors.
To start the report, press <Enter> through each field or simply press <F10>.
The report itself will detail the Inventory code,
Description, Inventory Group, Other Key, Barcode, Supplier, Quantity-on-hand,
Quantity-on-Sales-Orders, Quantity-on-Purchase-Orders, Available
Quantity-on-Hand (On-hand less units on Sales Orders plus units on Purchase
Orders), Sales PTD, Sales YTD sales), the Re-order point and the Maximum
stock-point. If you are printing short form reports, some of these fields will
be shortened or missing.